

The short answer: Measure CRM data quality with five numbers: duplicate rate, fill rate of the fields that matter, consistency of their values, freshness, and whether records are linked to the right accounts and owners. Measure them on the records and fields a team or AI tool actually uses rather than the whole CRM, set a target for each, combine them into a simple score, and check it every week, because the numbers drift as new data comes in.
The five CRM data quality metrics at a glance
| Metric | What it measures | Where to find it |
|---|---|---|
| Duplicate rate | Share of records with at least one likely duplicate, matched on domain, cleaned company name, and email | Salesforce duplicate record sets and reports; HubSpot data quality tools |
| Fill rate | Share of records where each important field has a usable value, counting placeholders like "N/A" as blank | Reports filtered on blank fields; HubSpot property insights |
| Consistency | Distinct values in picklists and key text fields, and the share outside your standard list | Summary reports grouped by the field |
| Freshness | Open deals with past close dates, bounced or inactive contacts, and accounts with no recent activity | Date and last activity filters in reports |
| Linkage | Contacts without the right account, deals without contact roles, subsidiaries without a parent, records owned by inactive users | Reports on lookup fields and owner status |
The rest of this guide covers how to scope, measure, and score each one.
Why a whole-CRM data quality score misleads
Most data quality reports look at every record and every field. That produces a number that is hard to act on. A CRM with 200 fields per object will always look incomplete, because most of those fields were built for one report years ago and nobody fills them. One team we work with has more than 100 account fields, and their reps reliably fill about five. Averaging all of them tells you nothing about whether the CRM works for the people and tools that use it.
The records also differ in importance. Duplicate prospects from a 2019 trade show list matter much less than a duplicate of a current customer. A score that weights them equally sends people to clean the wrong things.
So start from the use. A territory report, an AI SDR, a deal-qualification assistant in Claude, and an Agentforce service agent each read different objects and fields. Measure those.
Step 1: define the scope for each use case
For each team, report, or AI tool, list:
- The objects it reads. Accounts, contacts, leads, opportunities, activities, cases, custom objects.
- The record filter. For example: open opportunities, accounts owned by active reps, contacts on customer accounts, leads created in the last year.
- The fields it depends on. The ones it filters on, returns in answers, or uses to decide.
- The links it relies on. Contact to account, opportunity to account, subsidiary to parent, record to owner.
Write it down as a short table. This is your measurement scope, and it is usually a small fraction of the CRM. Our guide on how to get your CRM data ready for AI agents explains why scoping this way matters.
Step 2: measure five things on that scope
1. Uniqueness: the duplicate rate
What to measure: the share of in-scope records that have at least one likely duplicate. For accounts, match on domain (including alternate domains) and normalized company name. For contacts, match on email, and on name within the same account. For leads, check against existing contacts and accounts.
Break it out by type. A duplicate where one copy is a customer and the other is a prospect is far more damaging than two prospect copies, so report those separately. Why AI SDRs email the wrong people shows how that one pair type reaches your customers.
Where to get it: In Salesforce, duplicate rules create duplicate record sets you can report on with a custom report type, and duplicate jobs scan existing records, but duplicate jobs are only available in Performance and Unlimited editions. In HubSpot, the data quality tools list suspected duplicate contacts and companies and show how the count changes over a date range.
2. Completeness: fill rate of the fields that matter
What to measure: for each in-scope field, the percentage of in-scope records where it has a usable value. Treat placeholders like "Unknown," "N/A," or "-" as blank.
This is the number that decides whether an AI answer is useful. If you ask an assistant to name the economic buyer, decision criteria, and competitors on every open deal, and those fields are filled on a fifth of deals, most of the answers will come back as unknown. Measuring fill rate on those fields first shows the gap before the project starts.
Where to get it: Salesforce reports with a "field equals blank" filter, grouped by owner or segment, or a SOQL count. In HubSpot, property insights flag properties with no data, and list or report filters on "is unknown" give per-property counts.
3. Consistency: are the values usable
What to measure: for picklists and text fields the AI filters on, the number of distinct values and the share of records using a value outside your standard list. "United States," "USA," and "U.S." are three values for one country. Also look for competing fields that hold the same information, such as two industry fields filled by different teams.
Where to get it: a summary report grouped by the field shows every value and its count. HubSpot's data quality tools also flag formatting issues.
4. Freshness: is the record still true
What to measure depends on the object:
- Open opportunities with a close date in the past, or no activity in a set number of days.
- Contacts with bounced email, or not verified or active in the last year.
- Accounts with no activity in a year that are still marked active or owned.
- Cases or tasks left open after the work finished.
Where to get it: standard date and last activity filters in reports. Bounce data comes from your email or sequencing tool.
5. Linkage: are records connected correctly
What to measure:
- Contacts with no account, or attached to an account whose domain doesn't match their email.
- Open opportunities with no contact roles.
- Subsidiaries not linked to a parent account.
- Records owned by inactive users.
These are easy to overlook because each record looks fine on its own. They matter most for agents that summarize accounts, route requests, or decide who is a customer.
Step 3: turn the measurements into a score
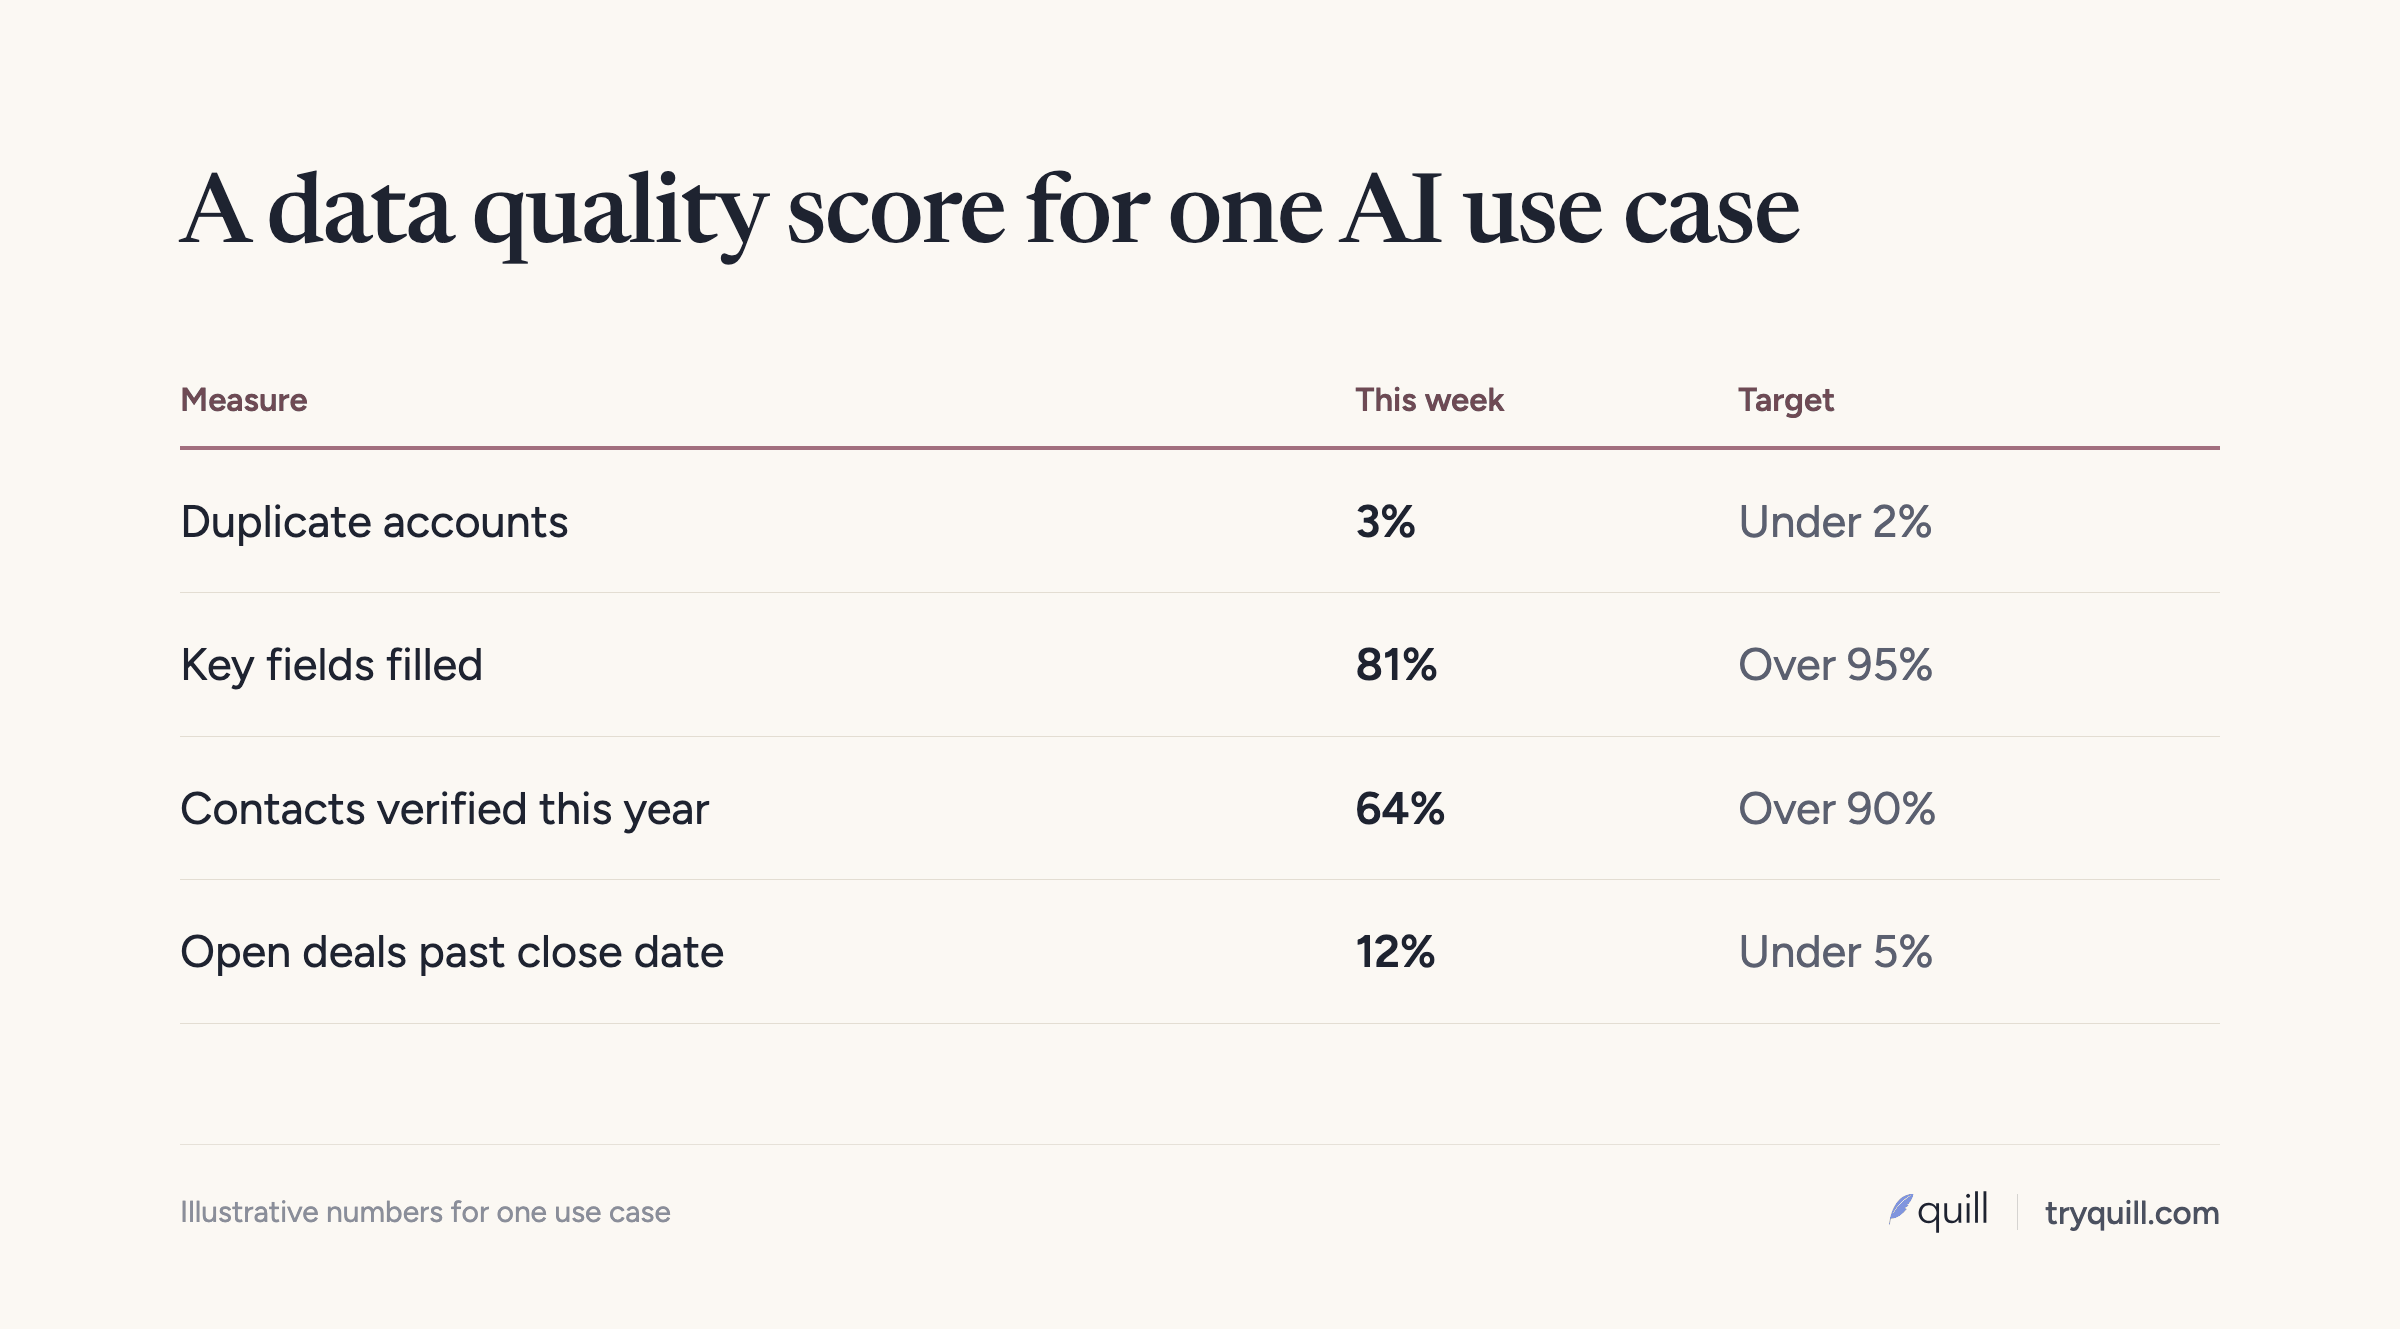
A score helps you track progress and explain it to leadership. Keep it simple enough that anyone can see why it moved.
- Pick a target for each metric. For example: under 2% duplicate rate on customer accounts, over 90% fill on segment and industry for open-pipeline accounts, zero open opportunities with past close dates. Concrete targets work better than a general goal. One RevOps team we work with set theirs as fewer than 500 duplicate accounts and sorted the backlog into high, medium, and low confidence to work it down.
- Score each metric against its target. At or above target is 100; halfway there is 50.
- Weight by impact on the AI use case. For an AI SDR, customer-prospect duplicates and contact freshness carry the most weight. For a forecasting assistant, stage, amount, and close date freshness do.
- Report the score per use case, with the metrics underneath. "AI SDR readiness 72" is useful only if the next line says the customer-prospect duplicate rate is the reason.
Here is an example. Suppose an assistant reads 2,000 open-pipeline accounts. 120 have a likely duplicate (6%, target 2%), 1,700 have a segment value (85%, target 90%), and 300 open opportunities have close dates in the past. The score is low mostly because of duplicates and stale close dates, which tells you where to spend the next two weeks.
Step 4: measure every week, not once
Data quality moves. New duplicates come from forms, imports, and the enrichment and sequencing tools that sync into the CRM. Contacts change jobs, reps skip fields, and deals go quiet. A score measured once before launch is out of date within weeks.
Run the same checks on the same scope weekly, and chart them. A sudden jump in the duplicate rate usually points to one integration or one import, so check what started syncing or loading that week. A slow decline in fill rate usually points to a process or a team. Either way you catch it before the AI's answers get worse. For an Agentforce-specific version of this checklist, see Agentforce data readiness.
How Quill helps
Quill's CRM Hygiene agents measure duplicates, fill rate, consistency, freshness, and linkage across Salesforce, HubSpot, and Attio, then propose fixes with the evidence behind each one. You set which fixes a person approves and which are auto-approved at high confidence, and the measurements keep running so you can see the trend. Book 15 minutes and we will run the numbers on the records your AI uses.
Frequently asked questions
What are the main CRM data quality metrics?
Duplicate rate, fill rate of important fields, consistency of values, freshness, and correct linkage between records and owners. Measure them on the records and fields a specific team or AI tool uses, not across the whole CRM.
How do I calculate a CRM data health score?
Set a target for each metric, score each metric against its target, weight them by how much they affect the use case, and combine. Report the score with the underlying metrics so people can see what moved it.
How do I find duplicates in Salesforce without duplicate jobs?
Use duplicate rules to flag new duplicates and report on duplicate record sets, and run reports grouped by website or normalized account name to find existing ones. Duplicate jobs are limited to Performance and Unlimited editions, so many teams use a dedicated deduplication tool for the backlog.
Does HubSpot measure data quality?
Yes. HubSpot's data quality tools show suspected duplicates, formatting issues, and property insights such as properties with no data, with trends over a date range. Bulk actions need Data Hub Starter or above, and automatic formatting rules need Data Hub Professional or Enterprise.
How often should I measure CRM data quality?
Weekly for records any AI tool or agent uses, and more often right after launches, migrations, or new integrations. The numbers change as new data comes in, so a one-time audit goes stale quickly.